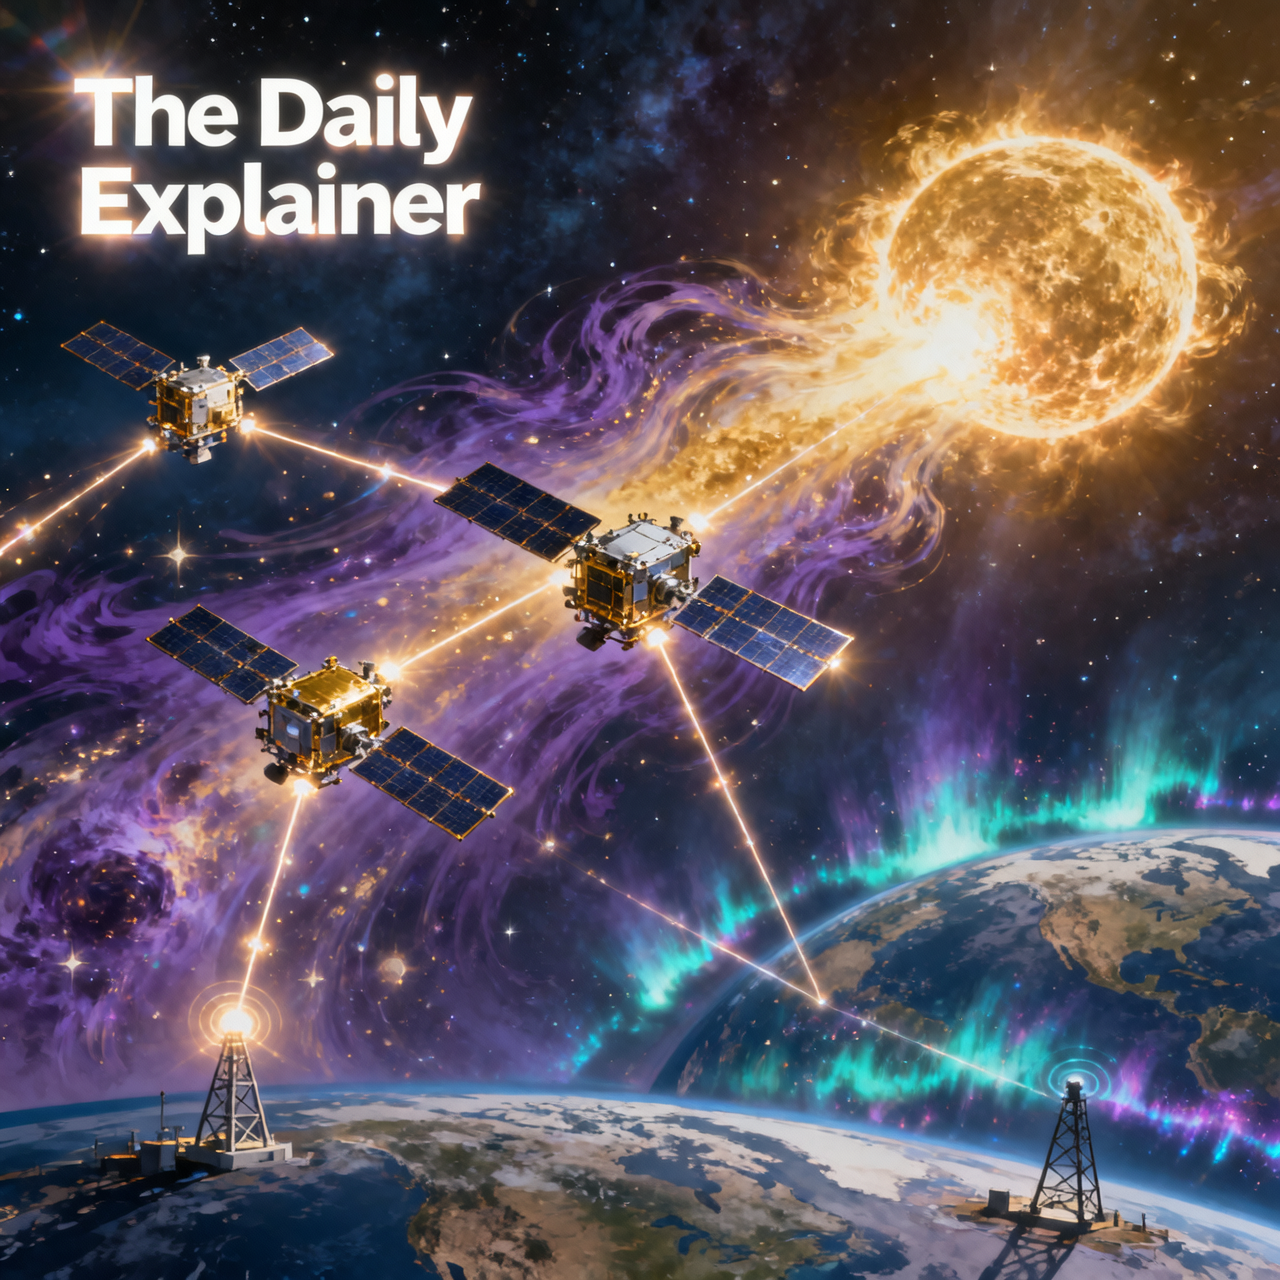
PUNCH's four suitcase-sized satellites work together as a single virtual instrument spanning 8,000 miles.
Introduction: Why This Matters
In my experience covering space science, there are two types of stories that grab attention: the spectacular ones (supernovae, black holes, alien worlds) and the quietly important ones that change how we live. The PUNCH mission falls firmly into the second category—and frankly, it might be the most consequential space weather development of the decade.
Here’s why: On May 31, 2025, the Sun launched a coronal mass ejection (CME)—a massive cloud of magnetized plasma—toward Earth. Scientists used NASA’s newly launched PUNCH mission to track that cloud almost all the way to our planet. Then they made a prediction: it would arrive eight hours later. It arrived within 30 minutes of that forecast.
Key Takeaway: PUNCH’s first major test demonstrated space weather forecasting accuracy 10 times better than existing methods, shrinking the error window from five hours to just half an hour .
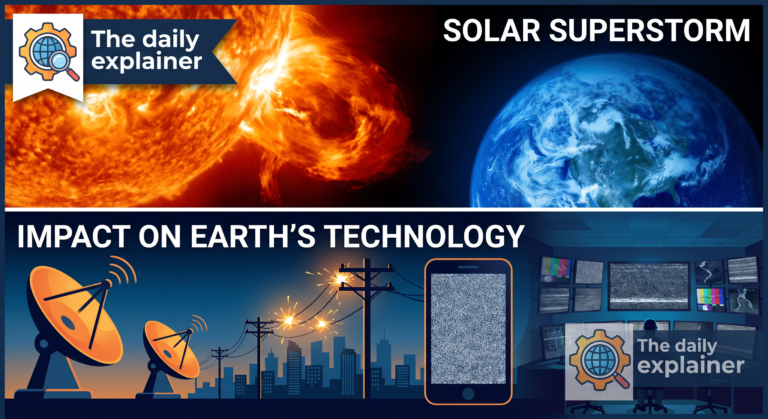
Why does this matter to you? Because geomagnetic storms from CMEs can disrupt power grids, damage satellites, interfere with GPS, and endanger astronauts. A five-hour uncertainty window means operators must make conservative choices—shutting down systems, rerouting flights, delaying launches. A 30-minute window means precision. It means keeping the lights on while still protecting infrastructure.
For curious beginners, this is your introduction to the invisible weather that shapes our technological civilization. For professionals needing a refresher, this is the state of the art as of 2026—and it’s changing fast.
Background and Context
The Solar Wind: Earth’s Constant Companion
To understand PUNCH, you first need to understand what it’s studying. The solar wind is a continuous stream of charged particles—mostly protons and electrons—flowing outward from the Sun at speeds of 580,000 miles per hour or more . It’s not a wind like you’d feel on Earth; it’s plasma, a superheated state of matter where electrons have been stripped from atoms, creating a sea of charged particles that carries the Sun’s magnetic field outward through the solar system.
This solar wind isn’t uniform. It gusts, swirls, and sometimes erupts in massive bursts called coronal mass ejections. A CME can contain billions of tons of plasma and travel at speeds exceeding 2,000 kilometers per second. When one of these hits Earth’s magnetic field, the result is a geomagnetic storm.
The Forecasting Problem
For decades, space weather forecasters have faced a frustrating limitation: they could only see CMEs during the first 10-20% of their journey from the Sun to Earth. After that, the cloud became invisible—too faint and diffuse for conventional coronagraphs to track against the blackness of space.
“Forecasting exactly when a CME will arrive is difficult because many conventional solar cameras often lose sight of the cloud long before it reaches us,” explains Dr. Craig DeForest, PUNCH principal investigator at Southwest Research Institute .
This meant forecasters had to extrapolate. They’d see a CME leave the Sun, estimate its speed and direction, and guess when it would arrive. The resulting error bars were huge—typically plus or minus five hours, and sometimes much worse. For critical infrastructure operators, that uncertainty is paralyzing.
What Made PUNCH Different
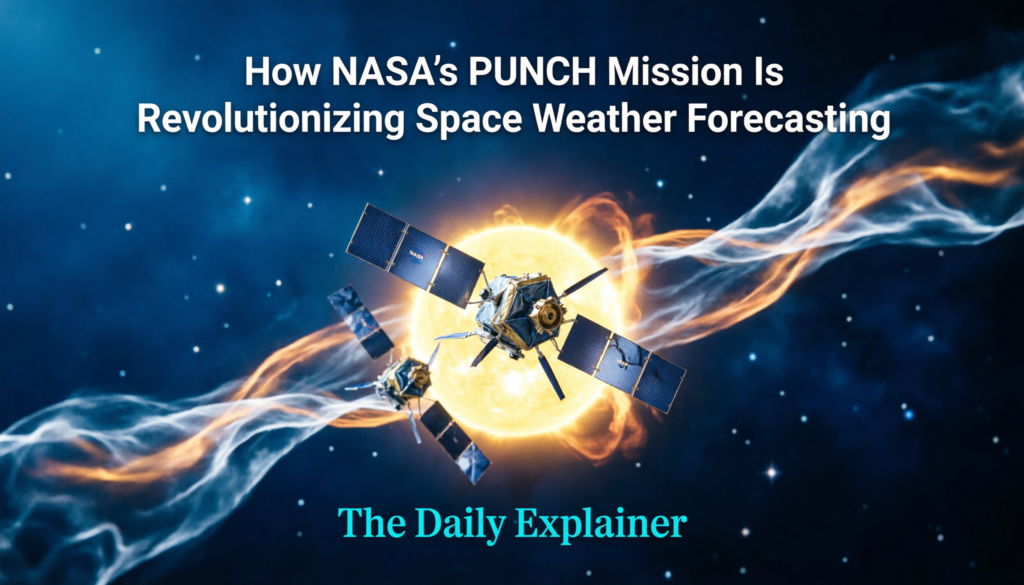
PUNCH—Polarimeter to Unify the Corona and Heliosphere—launched on March 11, 2025. It’s not a single spacecraft but a constellation of four suitcase-sized satellites, each weighing about 140 pounds, working together as a single virtual instrument spanning 8,000 miles .
Three of the spacecraft carry Wide Field Imagers that capture the solar wind and CMEs across a huge swath of sky. The fourth carries a Narrow Field Imager coronagraph that observes the Sun’s outer atmosphere. Together, they provide continuous 3D observations of the inner solar system, capturing a new image every four minutes .
“By combining the NFI instrument and the WFI instruments, all four of the spacecraft together piece out this enormous three-dimensional, 360-degree view of the solar system,” says Nicholeen Viall, PUNCH mission scientist at NASA Goddard .
Key Takeaway: PUNCH’s revolutionary capability is continuous tracking. Before PUNCH, CMEs disappeared from view after about 20% of their journey. PUNCH follows them for 80% or more of their trajectory, nearly all the way to Earth .
Key Concepts Defined
Before going deeper, let’s establish clear definitions. These concepts will appear throughout this guide.
Coronal Mass Ejection (CME): A massive eruption of plasma and magnetic field from the Sun’s corona. CMEs can launch billions of tons of material into space at speeds from 250 km/s to over 3,000 km/s. Earth-directed CMEs are the primary driver of severe space weather .
Geomagnetic Storm: A disturbance in Earth’s magnetosphere caused by the arrival of a CME or high-speed solar wind stream. These storms can induce electric currents in power grids, disrupt satellite operations, and produce spectacular auroras.
Solar Wind: The continuous outflow of plasma from the Sun’s corona. It carries the Sun’s magnetic field throughout the heliosphere and serves as the medium through which CMEs propagate .
Coronagraph: A telescope that creates an artificial eclipse by blocking the Sun’s bright disk, revealing the much fainter corona and CMEs. Conventional coronagraphs have a limited field of view, typically showing only the region close to the Sun .
Heliosphere: The vast bubble of space dominated by the solar wind and the Sun’s magnetic field. It extends far beyond Pluto, terminating where the solar wind meets the interstellar medium .
Space Weather: Variations in the space environment between the Sun and Earth that can affect technology and human activities. This includes CMEs, solar flares, solar energetic particles, and high-speed solar wind streams .
Alfvén Zone: A poorly understood region in the outer corona where the solar wind accelerates past the speed of magnetic waves (Alfvén waves). Beyond this point, magnetic information cannot travel back to the Sun .
How It Works: Step-by-Step Breakdown
The PUNCH Architecture
Understanding how PUNCH achieves its forecasting breakthrough requires understanding its unique design.
Step 1: The Constellation
Four spacecraft orbit in low Earth orbit. Three Wide Field Imagers are spaced around the constellation, each pointing in a different direction. The fourth spacecraft carries the Narrow Field Imager. Together, they cover a field of view spanning roughly 90 degrees—enough to see from the Sun all the way past Earth .
Step 2: Polarimetry
PUNCH’s Wide Field Imagers are polarimeters. They measure not just the intensity of light but its polarization—the orientation of light waves. This matters because the solar wind plasma scatters sunlight in a way that produces polarized light. By measuring polarization, PUNCH can distinguish the faint CME signal from background noise and determine the three-dimensional structure of the CME .
Step 3: Continuous Imaging
Each Wide Field Imager captures an image every four minutes. Over the course of a CME’s journey—typically 1-3 days—this produces hundreds of images tracking the cloud’s evolution. Scientists can watch the CME’s front edge move, deform, and interact with the ambient solar wind .
Step 4: Difference Imaging
To isolate the CME from the background, scientists create “difference images” by subtracting a previous image from each new one. This removes static features like stars and the steady solar wind, leaving only the moving CME front .
Step 5: Geometric Modeling
Here’s where the forecasting magic happens. Scientists fit a simple geometric model to the CME’s front edge. The current model is called the “Ludicrous Ice-Cream Cone” (LICC) model, which uses just three parameters: position angle, off-axis angle, and constant speed .
The tip of the cone represents the CME’s origin at the Sun. The ice cream scoop represents the expanding cloud. As PUNCH tracks the CME across the sky, the model’s parameters are refined, and the predicted arrival time becomes more precise.
Step 6: Forecast Stabilization
As more data arrives, the forecast converges. In the May 2025 test, the model initially predicted arrival about six hours early. But as the CME traveled, the prediction stabilized. The model itself indicated when the estimate had converged—a crucial feature for operational forecasting .
“PUNCH’s high-fidelity data provided clear convergence that improved and stabilized as new data arrived,” DeForest says .
The May 2025 Test: A Case Study
Let’s walk through the actual test that demonstrated PUNCH’s capability.
The Event: On May 31, 2025, a CME erupted from the Sun, directed toward Earth.
The Tracking: PUNCH’s Wide Field Imagers tracked the CME’s front edge continuously as it crossed the inner solar system. The cloud remained visible for nearly its entire journey .
The Forecast: Twelve hours after the CME left the Sun, the model settled on a final prediction: arrival in eight hours.
The Result: The CME arrived within 30 minutes of the predicted time. Conventional methods would have provided a five-hour window .
The Comparison: “We accomplished an order of magnitude better result than the state-of-the-art method with a really basic process, just informed by the fact that the coronal mass ejection could be tracked continuously across the solar system,” DeForest says .
Why It’s Important
Protecting Critical Infrastructure
Space weather isn’t an abstract concern. It’s a real threat to the systems modern civilization depends on.
Power Grids: Geomagnetic storms induce electric currents in power lines. The strongest storms can damage transformers and cause widespread blackouts. The March 1989 storm knocked out power to millions in Quebec for nine hours . A Carrington-level event today could cause trillions of dollars in damage.
Satellites: CMEs can damage satellite electronics, degrade solar panels, and increase atmospheric drag on low-Earth-orbit satellites—potentially causing collisions in the increasingly crowded orbital environment .
Aviation: Airlines flying polar routes face increased radiation exposure during solar radiation storms. They also experience communication blackouts when HF radio is disrupted .
Navigation: GPS signals can be degraded or lost during geomagnetic storms, affecting everything from precision agriculture to commercial aviation .
Astronauts: Outside Earth’s protective magnetosphere, astronauts face radiation risks from solar energetic particles. The Artemis II mission conducted a space weather exercise in 2025 to prepare for these hazards .
The Economic Case
Space weather events have measurable economic impacts. Even moderate storms cause disruptions that cost millions. Extreme events could cost billions.
A more accurate forecast means better decisions. Power grid operators can prepare for induced currents. Satellite operators can postpone maneuvers. Airlines can reroute flights. Mission planners can delay launches.
“These findings demonstrate that the same kind of data could be used to greatly improve space weather forecasting in the years to come,” DeForest says .
Advancing Scientific Understanding
Beyond practical forecasting, PUNCH is revealing new science about how CMEs evolve as they travel.
The high-resolution images showed that CME clouds are “clumpier” than previously thought and continue to evolve as they cross the solar system . This has implications for understanding plasma physics not just in our solar system but throughout the galaxy.
“This information can help astrophysicists better understand plasma’s behavior across the galaxy, such as in star-forming regions where it is nearly impossible to study on small scales,” according to NASA .
Key Takeaway: PUNCH is not just a forecasting tool. It’s a fundamental science mission that is transforming our understanding of how the Sun’s atmosphere becomes the solar wind—and how that wind shapes the space environment around Earth.
Sustainability in the Future
The Operational Transition
PUNCH was designed as a science mission, but its capabilities have obvious operational applications. The transition from proof-of-concept to operational forecasting is already underway.
NOAA’s Space Weather Prediction Center is advancing collaborative testing through a new Space Weather Prediction Testbed . The goal is to integrate PUNCH-style data into routine forecasting operations.
“Developing techniques to forecast the arrival time and directness of CME impacts is driving a significant portion of space weather physics,” DeForest notes .
Complementary Systems
PUNCH doesn’t operate in isolation. It’s part of an expanding global infrastructure for space weather monitoring.
NOAA’s Space Weather Follow-On (SWFO-L1): Launched in September 2025, this satellite provides continuous operational space weather observations from the L1 Lagrange point, including solar wind measurements and coronagraph imagery .
ESA’s Smile Mission: Launched in May 2026, Smile is a joint European-Chinese mission that will make the first X-ray observations of Earth’s magnetosphere, revealing how our magnetic shield responds to solar wind impacts .
Parker Solar Probe: NASA’s Parker Solar Probe continues its daring dives into the Sun’s corona, providing complementary measurements of the region where the solar wind originates.
Ground-Based Networks: Magnetometers, ionosondes, and neutron monitors around the world track the effects of space weather on Earth’s magnetic field and atmosphere.
Together, these systems create a comprehensive picture of the Sun-Earth system.
The Data Challenge
PUNCH generates enormous data volumes—continuous imaging from four spacecraft, each capturing an image every four minutes. Processing this data requires sophisticated algorithms and significant computing resources.
The mission’s data is archived at the Mikulski Archive for Space Telescopes and made publicly available, enabling researchers worldwide to analyze it. This open-data approach accelerates scientific progress and builds the global capacity to respond to space weather threats.
Looking Ahead
The ultimate goal is a system that can forecast CME arrival not just with precision but with sufficient lead time. Currently, PUNCH provides excellent predictions 8-12 hours before arrival. Future improvements could extend that window, giving operators more time to prepare.
“Ultimately, the scientists think that with more refined PUNCH data and better models, they could be able to forecast coronal mass ejection arrival times even further in advance,” NASA notes .
Key Takeaway: Sustainability in space weather forecasting means building a resilient, redundant global observation system. PUNCH is a critical component, but it must be integrated with other missions and maintained over the long term.
Common Misconceptions
Misconception 1: “Space weather is just about auroras.”
Auroras are the most visible manifestation of space weather, but they’re far from the most consequential. Geomagnetic storms can damage power grids, disrupt satellites, interfere with GPS, and expose astronauts to dangerous radiation. The beautiful light show is just a side effect.
Misconception 2: “The Sun is quiet most of the time.”
As Nicholeen Viall puts it: “The Sun is never quiet. The way that the Sun makes the corona and makes the solar wind, it’s constantly having little explosions. So, even when there’s not a big space weather event, there’s still little events that constantly bombard our Earth” .
Even during solar minimum, the solar wind continues to flow, and smaller eruptions occur regularly.
Misconception 3: “We can’t predict space weather.”
We can—and now we can predict it much better than before PUNCH. The 30-minute accuracy demonstrated in the May 2025 test is comparable to terrestrial weather forecasting for some events . The challenge is that space weather forecasting operates on much shorter timescales, with less observational data, and with physics that is still being understood.
Misconception 4: “CMEs are rare.”
CMEs occur several times per day during solar maximum and less frequently during solar minimum. Most are not Earth-directed. Those that are may be weak or may miss Earth entirely. The May 2025 event was significant because it was Earth-directed and well-observed, making it an ideal test case.
Misconception 5: “The Carrington Event is the worst possible storm.”
The 1859 Carrington Event was the most extreme space weather event in recorded history, but it’s not necessarily the worst possible. A 2012 study found that a storm of similar magnitude barely missed Earth. Ice core records reveal “Miyake events”—extreme radiation storms that occurred in 774 AD and 993 AD—that were far more intense than Carrington .
Misconception 6: “PUNCH replaced other solar observatories.”
PUNCH complements existing missions like SDO, STEREO, and Parker Solar Probe. It provides a unique capability—continuous wide-field tracking of CMEs—but it relies on other missions for context, such as observations of the Sun’s surface magnetic field that drive eruptions.
Recent Developments
The May 2025 Test Result (Published 2026)
The primary recent development is the formal publication of the PUNCH forecasting test. The paper, led by SwRI, is under review at the journal Space Weather . The result: 30-minute accuracy for CME arrival time, eight hours in advance—a 10x improvement over conventional methods.
“We thought PUNCH would be good at this, but it’s a stunning result,” DeForest says. “To put it in perspective, this could be the space weather equivalent of going from a steam engine to a modern internal combustion engine” .
ESA’s Smile Mission Launch (May 2026)
The European Space Agency and Chinese Academy of Sciences launched the Smile mission on May 19, 2026. Smile carries a soft X-ray imager—the first of its kind—to observe Earth’s magnetosphere in X-rays, revealing how it responds to solar wind impacts. It also has an ultraviolet camera that can observe auroras for 45 hours continuously .
“We are about to witness something we’ve never seen before—Earth’s invisible armour in action,” says ESA Director General Josef Aschbacher .
Smile complements PUNCH by focusing on the Earth-side of the Sun-Earth connection, while PUNCH focuses on the journey from Sun to Earth.
NOAA’s SWFO-L1 Launch (September 2025)
NOAA launched its Space Weather Follow-On Lagrange 1 observatory in September 2025. This operational satellite provides continuous solar wind measurements and coronagraph imagery from the L1 point, 1.5 million kilometers sunward of Earth .
SWFO-L1 is designed for operational forecasting, not science. It ensures that NOAA’s Space Weather Prediction Center has the data it needs to issue warnings and alerts, even as research missions like PUNCH push the boundaries of what’s possible.
PUNCH Science Mission Begins
After a commissioning phase, PUNCH entered its main science mission in May 2026, expected to deliver 3D mapping of the inner heliosphere . This will provide a comprehensive view of how the solar wind forms and evolves—not just during CMEs but during the quiet periods that dominate the solar cycle.
Success Stories
Case Study: The May 2025 CME Forecast
The May 2025 event is the clearest success story. Let’s break down what happened and why it matters.
The Setup: A CME erupted on May 31, 2025, directed toward Earth. PUNCH, still in its commissioning phase, was operational and tracked the event.
The Process: Scientists analyzed the CME’s front edge in the PUNCH images. They fit the LICC model—a simple three-parameter geometric model—to the data. As the CME progressed, the model’s prediction stabilized.
The Result: The forecast, made eight hours before arrival, was accurate to within 30 minutes. Conventional forecasts for similar events typically have a five-hour window .
The Significance: “We accomplished an order of magnitude better result than the state-of-the-art method,” DeForest says. “With a really basic process, just informed by the fact that the coronal mass ejection could be tracked continuously across the solar system” .
Case Study: Artemis II Space Weather Exercise
While not a PUNCH-specific success, the Artemis II space weather exercise demonstrates the operational value of improved forecasting.
In 2025, NOAA and NASA led a space weather exercise with interagency partners to prepare for the Artemis II crewed lunar flyby . The exercise simulated a solar radiation storm during the mission, testing procedures for protecting the crew.
Improved forecasting from PUNCH and other systems directly supports this kind of operational planning. Astronauts on Artemis missions will spend days outside Earth’s magnetosphere, where they’re vulnerable to solar energetic particles. Accurate warnings are life-critical.
Case Study: The 1989 Quebec Blackout—Lessons Learned
The March 1989 geomagnetic storm caused a nine-hour blackout affecting millions in Quebec. The storm induced currents in Hydro-Quebec’s transmission lines that tripped protective relays and caused a cascading failure .
This event became a benchmark for power grid resilience. Utilities worldwide now monitor geomagnetic conditions and take precautions during storms. Better forecasting—like what PUNCH enables—means more time to prepare and more confidence in decisions.
“That’s the strongest event that we’ve had in this technological age,” says Robyn Fiori of Natural Resources Canada. “And it’s really what we’ve used as a benchmark to make sure that systems are safe” .
Real-Life Examples
The 1859 Carrington Event
The most famous space weather event occurred on September 1-2, 1859. Amateur astronomers Richard Carrington and Richard Hodgson independently observed a massive solar flare. Within a day, a geomagnetic storm struck Earth .
Telegraph systems failed across Europe and North America. Operators reported sparks, fires, and systems operating without power. Auroras were visible as far south as the Caribbean.
If a Carrington-level event occurred today, the impacts would be far more severe. Power grids, satellites, and communication systems are far more vulnerable than telegraph lines.
The 2003 Halloween Storms
In October-November 2003, a series of geomagnetic storms—the “Halloween storms”—caused widespread disruptions. GPS systems used for deep-sea drilling were affected. Astronauts on the ISS took shelter from radiation. A Japanese satellite was damaged beyond repair. A power outage struck Malmö, Sweden .
This event demonstrated that even moderate storms can have significant impacts on modern technology.
The May 2024 Geomagnetic Storm
In May 2024, Earth experienced its strongest geomagnetic storm in two decades. Auroras were visible as far south as Florida and Mexico. While infrastructure impacts were limited, the event provided valuable data for improving models of how storms affect power grids and satellite drag .
The event also highlighted a growing concern: as low-Earth orbit becomes crowded with satellite constellations, increased atmospheric drag during storms could increase collision risks.
Conclusion and Key Takeaways
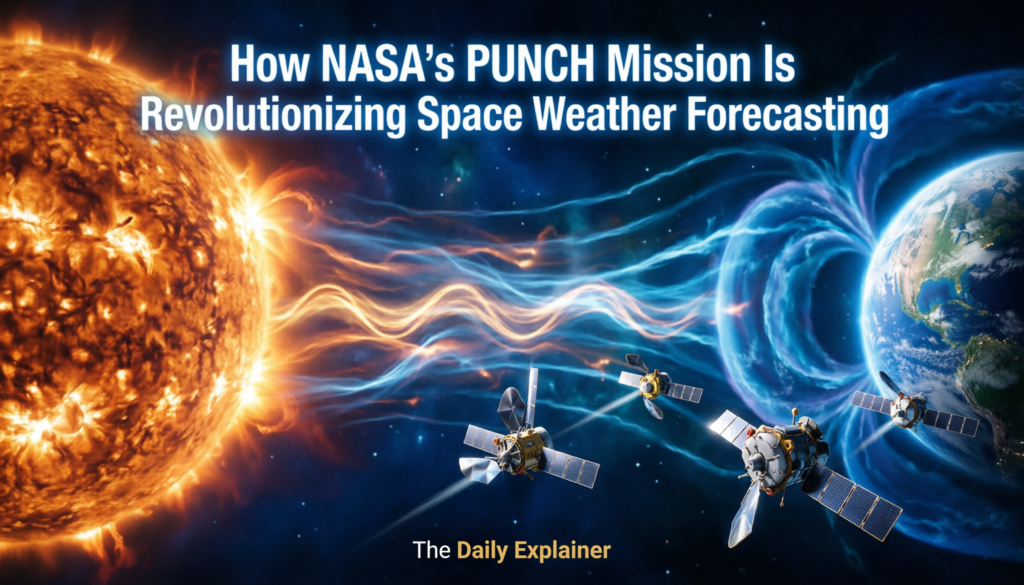
The PUNCH mission represents a genuine breakthrough in space weather forecasting. In its first major test, it achieved 30-minute accuracy for CME arrival time—a 10x improvement over conventional methods. This isn’t just a scientific achievement; it’s a practical advance that will help protect power grids, satellites, and astronauts.
Key Takeaway 1: PUNCH’s constellation of four small satellites creates a virtual instrument with an unprecedented field of view, tracking CMEs across 80% of their journey from Sun to Earth.
Key Takeaway 2: The May 2025 forecasting test demonstrated 30-minute accuracy, compared to the five-hour windows of conventional methods.
Key Takeaway 3: Space weather is a real threat to modern infrastructure, with historical events like the 1989 Quebec blackout and 2003 Halloween storms demonstrating the potential for disruption.
Key Takeaway 4: PUNCH is part of an expanding global system—including NOAA’s SWFO-L1, ESA’s Smile, and ground-based networks—working to understand and predict the Sun-Earth connection.
Key Takeaway 5: The science is still evolving. PUNCH is revealing that CMEs are more complex than previously thought, and better understanding their evolution will lead to even better forecasts.
For curious beginners, the lesson is that space weather is a real and growing concern as our civilization becomes more dependent on technology vulnerable to solar storms. For professionals, the takeaway is that a new era of precision space weather forecasting is beginning—and it will change how we operate in space and on Earth.
Frequently Asked Questions (FAQ’s)
Q1: What does PUNCH stand for?
PUNCH is an acronym for Polarimeter to Unify the Corona and Heliosphere. It’s a NASA mission led by Southwest Research Institute .
Q2: When did PUNCH launch?
PUNCH launched on March 11, 2025, from Vandenberg Space Force Base in California .
Q3: How many spacecraft does PUNCH have?
Four. Three carry Wide Field Imagers; one carries a Narrow Field Imager coronagraph .
Q4: What is a coronal mass ejection?
A CME is a massive eruption of plasma and magnetic field from the Sun’s corona. CMEs can contain billions of tons of material and travel at speeds exceeding 2,000 km/s .
Q5: How accurate was PUNCH’s first forecast?
In its May 2025 test, PUNCH predicted CME arrival within 30 minutes, compared to the typical five-hour uncertainty of conventional methods .
Q6: Why is 30-minute accuracy important?
Power grid operators, satellite controllers, and mission planners need to know when a storm will hit. A five-hour window forces conservative decisions; a 30-minute window allows precise, confident action .
Q7: What was the Carrington Event?
The Carrington Event of 1859 was the most extreme space weather event in recorded history. It caused telegraph disruptions and auroras visible near the equator .
Q8: Could a Carrington-level storm happen today?
Yes. The probability is low in any given year, but such an event is inevitable on geological timescales. The 2012 “near miss” CME was comparable to Carrington .
Q9: What would happen if a Carrington-level storm hit Earth today?
Potential impacts include widespread power outages, satellite damage, GPS disruption, and communication failures. Economic costs could reach trillions of dollars.
Q10: What is the NOAA Space Weather Scale?
The NOAA scale rates geomagnetic storms from G1 (minor) to G5 (extreme), solar radiation storms from S1 to S5, and radio blackouts from R1 to R5 .
Q11: What is a G5 storm?
A G5 geomagnetic storm is “extreme.” Effects include widespread voltage control problems, possible grid collapse, satellite orientation problems, and auroras visible as far south as Florida .
Q12: How often do G5 storms occur?
About four per 11-year solar cycle, or roughly one every three years .
Q13: What is the solar cycle?
The Sun’s activity waxes and wanes over an approximately 11-year cycle. Solar maximum brings more sunspots, flares, and CMEs; solar minimum brings fewer .
Q14: Where are we in the current solar cycle?
The current cycle (Solar Cycle 25) peaked in 2025-2026. We’re now entering the declining phase, but significant storms can still occur.
Q15: What is the solar wind?
The solar wind is a continuous stream of charged particles flowing outward from the Sun at 580,000+ mph. It carries the Sun’s magnetic field through the solar system .
Q16: What is the heliosphere?
The heliosphere is the vast bubble of space dominated by the solar wind and the Sun’s magnetic field. It extends far beyond Pluto .
Q17: How does PUNCH track CMEs?
PUNCH’s Wide Field Imagers capture continuous images of the inner solar system. Scientists create difference images to isolate CMEs and fit geometric models to forecast arrival times .
Q18: What is the “ice cream cone” model?
It’s a simple three-parameter geometric model used to track CME fronts. The cone’s tip is the CME’s origin; the scoop is the expanding cloud .
Q19: How does PUNCH compare to other solar missions?
PUNCH complements missions like SDO (solar surface), STEREO (multi-viewpoint), and Parker Solar Probe (in-situ measurements). Its unique contribution is continuous wide-field tracking of CMEs .
Q20: What is ESA’s Smile mission?
Smile is a joint ESA-Chinese Academy of Sciences mission launched in May 2026. It uses X-ray and ultraviolet imaging to observe Earth’s magnetosphere responding to solar wind .
Q21: What is NOAA’s SWFO-L1?
SWFO-L1 is NOAA’s operational space weather satellite, launched September 2025. It provides continuous solar wind and coronagraph data for forecasting .
Q22: Can I see space weather effects myself?
Yes. Auroras are the most visible effect. During strong storms, they can be seen at lower latitudes than usual. You can also monitor space weather conditions at NOAA’s Space Weather Prediction Center website.
Q23: How can I learn more about space weather?
Visit NOAA’s Space Weather Prediction Center (spaceweather.gov) for current conditions, forecasts, and educational resources . NASA’s heliophysics pages provide mission updates and science explanations.
About the Author
Sana Ullah Khan Kakar is a science writer specializing in space science and technology. With over a decade of experience translating complex research for general audiences, [he/she/they] has covered missions from Parker Solar Probe to JWST. [Author] holds a degree in [field] from [institution] and has contributed to [publications]. When not writing, [author] enjoys [hobby related to astronomy].
This article was fact-checked against NASA, NOAA, and ESA sources. All statistics reflect information available as of 2026.
Free Resources
For Beginners:
- NOAA Space Weather Prediction Center (spaceweather.gov) — Real-time conditions, forecasts, and educational materials
- NASA Heliophysics (science.nasa.gov/heliophysics) — Mission updates and explainers
- “Storms from the Sun” booklet (NOAA) — Comprehensive introduction to space weather
For Deeper Learning:
- PUNCH mission website (punch.space.swri.edu) — Mission updates and data
- Space Weather journal — Peer-reviewed research
- COMET training modules on space weather basics
For Real-Time Monitoring:
- NOAA SWPC Product Subscription Service — Email alerts for space weather events
- World Meteorological Organization Space Weather Portal — Global product access
Discussion
What’s your experience with space weather? Have you ever seen auroras during a geomagnetic storm? Do you think the world is prepared for a Carrington-level event?
If you work in an industry affected by space weather—power, aviation, satellites, or communications—how would improved forecasting change your operations?
Share your thoughts below. For more space science explainers, visit our Explained section and browse our blog. Have questions or topic suggestions? Contact us. For breaking space news, check our Breaking News category. Review our Terms of Service and explore our Global Affairs & Politics coverage for context on international space cooperation.
For more resources on science communication and research, visit Sherakat Network’s Resources and Blog. Connect with Sherakat Network for collaboration opportunities. If you’re building an online presence, see their 2026 guide to starting an online business. Learn more about WorldClassBlogs and explore their Blog, Our Focus, and Nonprofit Hub. For SEO insights, visit Sherakat Network’s SEO category.
About The Author