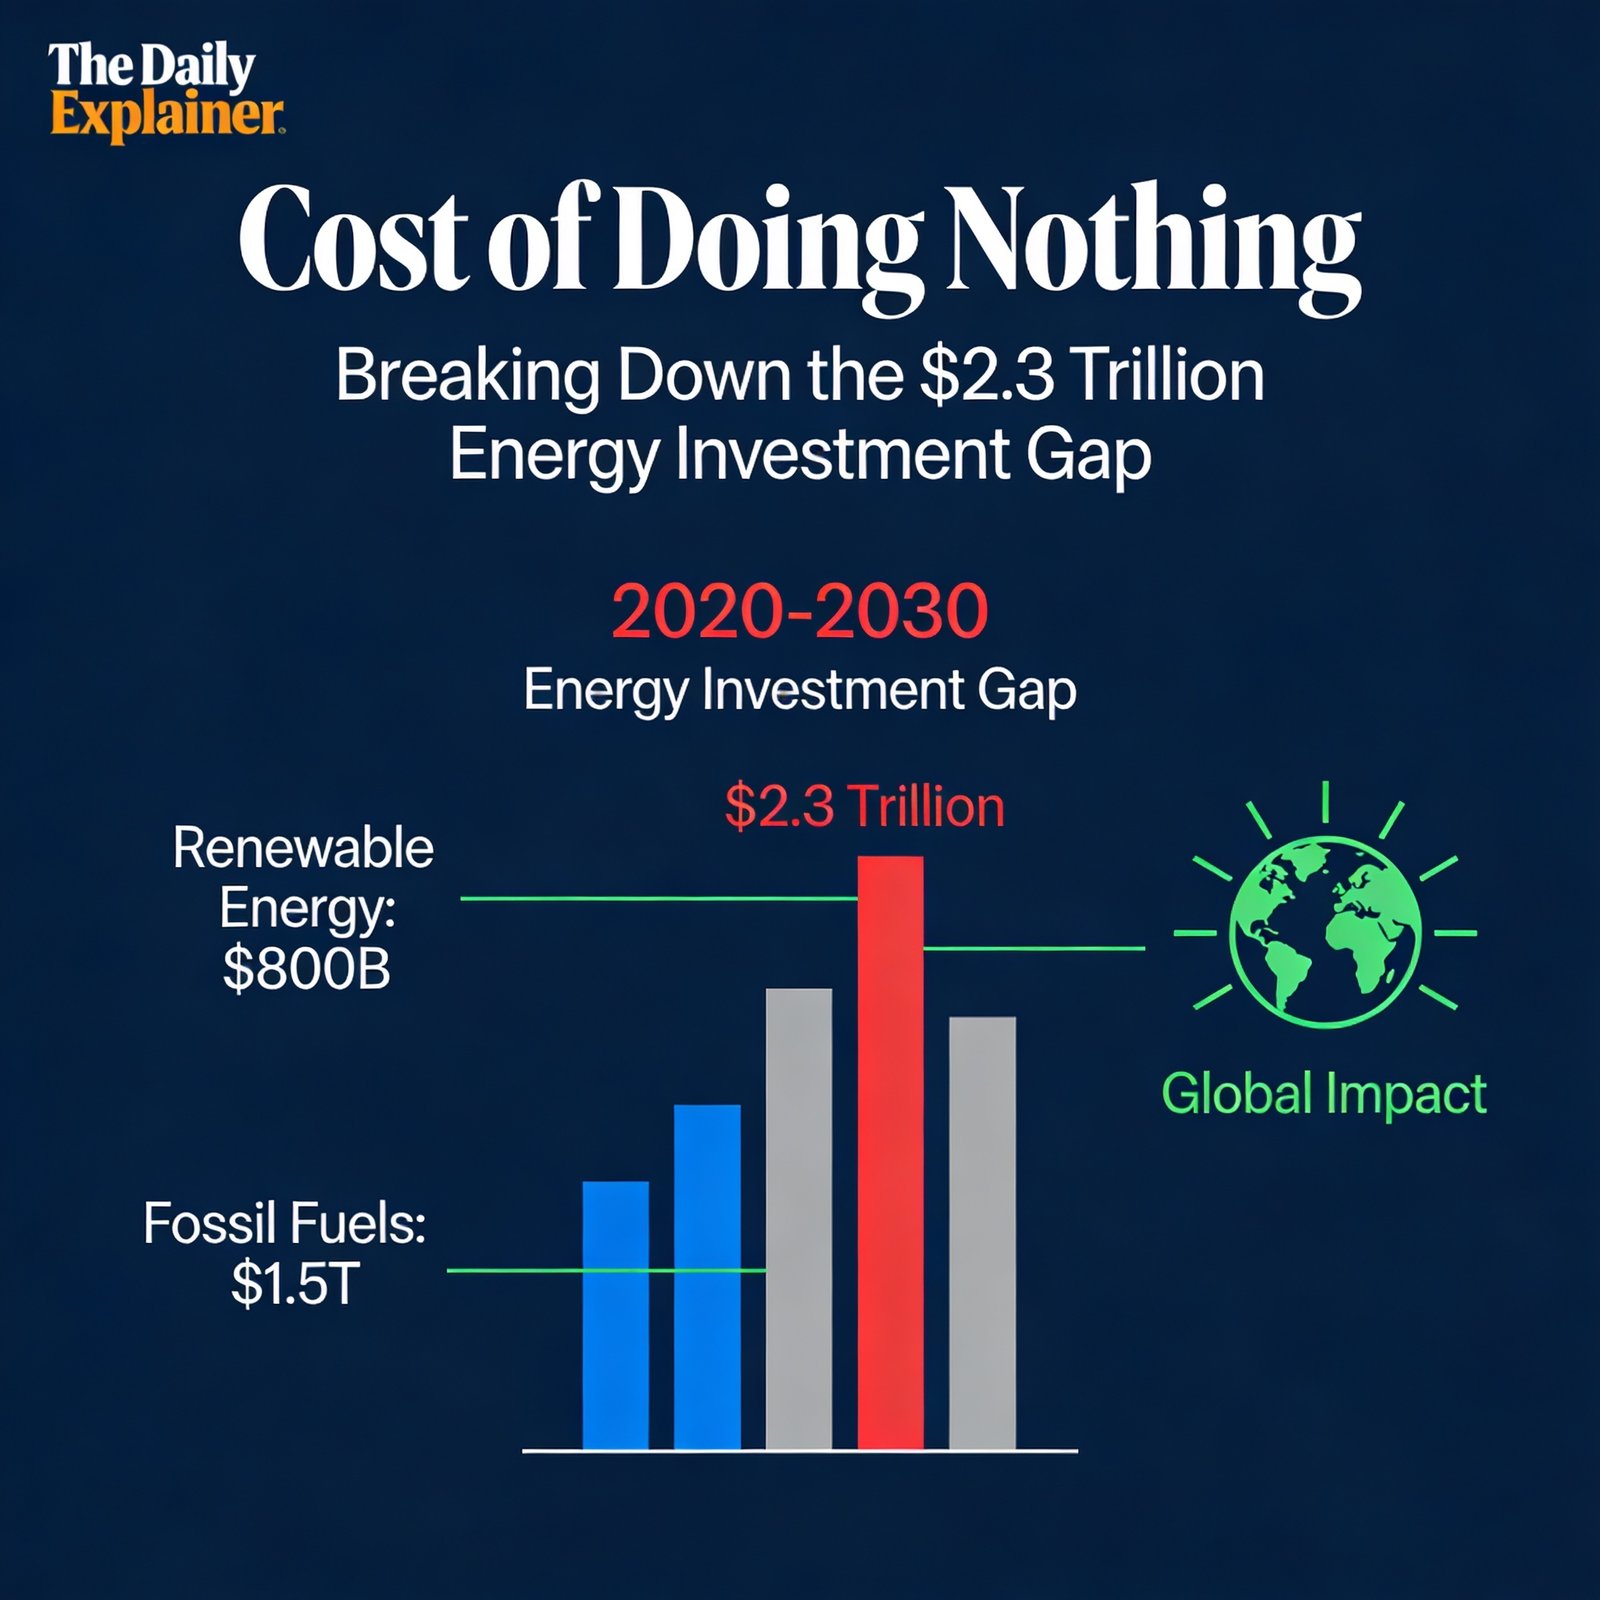
Global clean energy investment reached 2.3 t r i l l i o n i n 2025 , u p 8 2.3trillionin2025,up84.5 trillion needed annually by 2030 to meet 1.5°C targets.
Introduction – Why This Matters
In my experience advising policymakers and corporate sustainability officers over the past decade, I have encountered a persistent, frustrating question. It comes in different forms, but the meaning is always the same.
“Do we really need to spend all this money now? Can’t we wait a few years? The economy is uncertain. Inflation is high. Let’s just keep using natural gas and coal for a little longer. Let the technology mature. Let prices come down.”
I understand the instinct. Trillions of dollars is a frightening number. The global energy transition investment in 2025 reached $2.3 trillion, according to BloombergNEF. That is more than the GDP of Australia, or the combined economies of Sweden, Poland, and Belgium. It is an astronomical sum.
What I’ve found is that most people, including many professionals, see only half of the equation. They see the cost of action. They don’t see the cost of inaction.
Here is the 2026 reality that keeps me up at night: The cost of doing nothing is already higher than the cost of the transition.
We are already paying for climate change. We are paying through crop failures (which raise food prices), through wildfire suppression (which costs California $10 billion in 2025 alone), through hurricane damage (which costs the US $150 billion in 2024–2025), through heat-related health emergencies, through supply chain disruptions, through refugee resettlement, and through military conflicts over resources.
The $2.3 trillion we invested in 2025 is not a cost. It is an investment in avoiding far higher costs.
This article breaks down the economics of the energy transition in 2026. It explains where the $2.3 trillion went, where the remaining investment gap lies, the massive costs we will incur if we fail to close that gap, and how the technologies we’ve explored in this series — sand batteries, transformers, agrivoltaics, and heat pumps — fit into the solution.
Background / Context
The Trillion-Dollar Tipping Point
For decades, climate economists have argued about the cost of action. The Stern Review in 2006 estimated that climate action would cost 1% of global GDP per year, while inaction would cost 5–20% of GDP forever. Critics called it alarmist.
In 2026, those critics have been proven wrong — but not in the way anyone hoped. The costs of inaction are already materializing, and they are already exceeding the costs of action.
Let me give you a specific example. In 2025, the United States experienced 28 separate billion-dollar weather disasters — the second-highest count on record. The total cost: 182billion.That same year, global investment in renewable energy was 2.3 trillion. The US share of that investment was approximately $250 billion (about 11% of the global total, consistent with the US share of global GDP).
In other words, the United States spent $250 billion to∗transition∗its energy system and 182 billion to clean up climate disasters. The cost of inaction (disaster cleanup) was 73% of the cost of action (energy transition). And those disaster costs are rising every year.
Now, multiply this across every country, every year, for decades. The math becomes terrifying.
The Investment Gap Defined
The “energy investment gap” is the difference between what we are currently investing in clean energy and what we need to invest to meet the Paris Agreement goals of limiting warming to 1.5°C or 2.0°C.
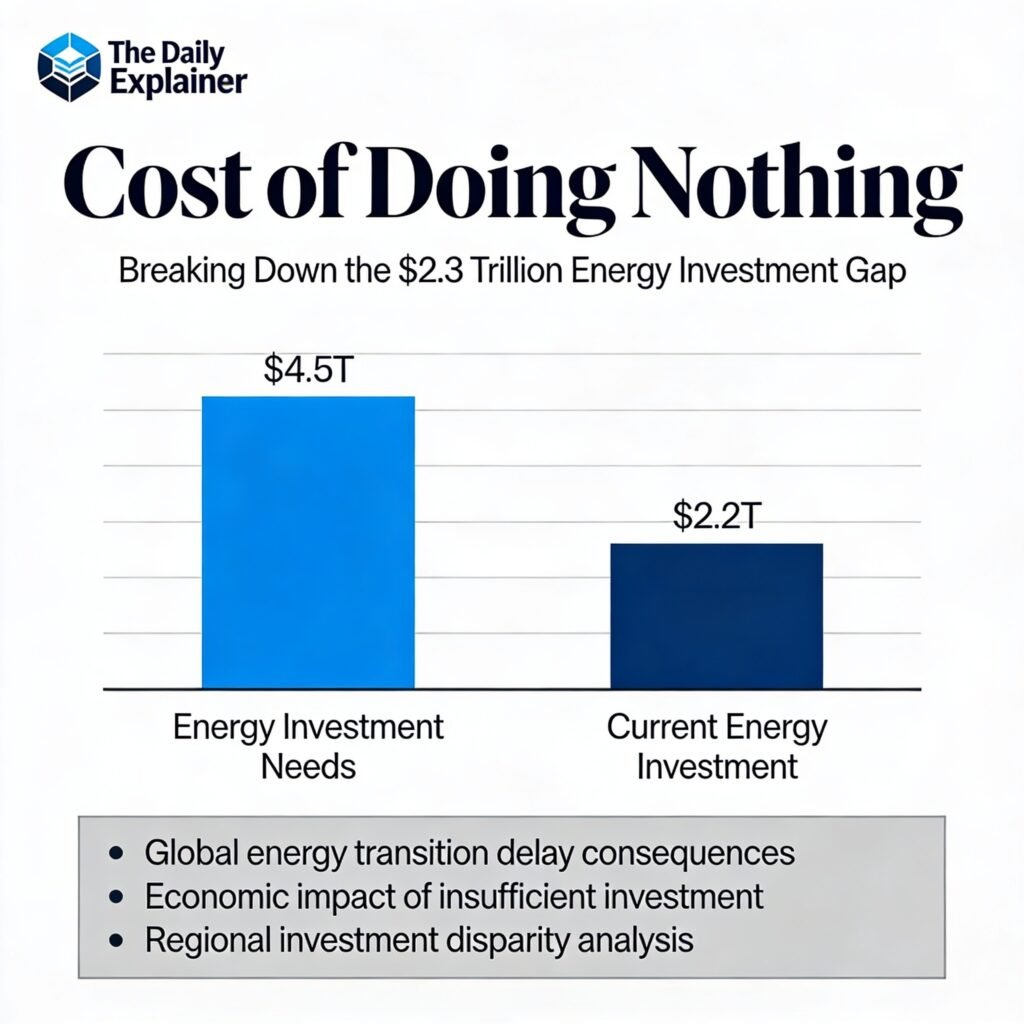
According to the International Energy Agency (IEA) World Energy Investment 2026 report, global clean energy investment needs to reach 4.5trillionperyearby2030tohitthe1.5°Ctarget.In 2025, we invested 2.3 trillion. The gap is $2.2 trillion per year.
That is the headline number, but it hides important nuance. The gap is not evenly distributed:
- By sector: The largest gaps are in grid infrastructure (800billionperyearshortfall), industrial heat decarbonization (500 billion shortfall), and emerging economy clean energy ($600 billion shortfall).
- By geography: Developed economies (the US, Europe, Japan, and Australia) are investing at roughly 70% of the required levels. China is at 90% of the required levels. Emerging economies (India, Brazil, Southeast Asia) are at 30%. Africa is at 5%.
- By technology: Solar and wind are fully funded (actually, they are overfunded relative to deployment capacity — the transformer shortage is the constraint, not capital). Grid storage, thermal storage (like sand batteries), transmission expansion, and industrial electrification are severely underfunded.
Who Is Paying? (The 2026 Investment Map)
The $2.3 trillion invested in 2025 came from multiple sources:
- Private investment (60%): Corporations, utilities, private equity, venture capital, project finance. This includes solar and wind farms, EV manufacturing, and battery factories.
- Government investment (25%): Direct spending on grid upgrades, public transit, research and development, and green industrial policy (e.g., US Inflation Reduction Act, EU Green Deal).
- Households (15%): Spending on rooftop solar, heat pumps, EVs, energy efficiency retrofits. This category is growing fastest, up 35% from 2020.
The gap — the missing $2.2 trillion — would need to come from the same sources. The question is how to unlock it.
Key Concepts Defined
- Energy Investment Gap: The difference between actual clean energy investment and the investment required to meet climate targets.
- Levelized Cost of Energy (LCOE): The average cost to generate one unit of electricity over a power plant’s lifetime, including construction, fuel, operation, and maintenance. Solar and wind now have lower LCOE than coal and gas in most of the world.
- Avoided Cost: The economic damages avoided by taking climate action (e.g., preventing a hurricane’s destruction). This is the denominator in cost-benefit analysis.
- Social Cost of Carbon (SCC): An economic metric that estimates the dollar value of damages caused by emitting one ton of CO2. The US government’s current SCC is 51perton(2020value,beingupdatedto190 per ton in 2026). At 190/ton,the35billiontonsofCO2emittedgloballyin2025caused6.7 trillion in damages.
- Sunk Costs vs. Avoidable Costs: Sunk costs are already spent and cannot be recovered (e.g., existing coal plants). Avoidable costs are future costs that can be prevented by action (e.g., new coal plant emissions). The transition focuses on avoidable costs.
- Stranded Assets: Existing fossil fuel assets (oil wells, coal mines, gas power plants) that become uneconomic before the end of their useful life due to climate policy or market shifts. Estimated stranded asset value: $1–4 trillion globally.
- Green Premium: The additional cost of a clean technology compared to a fossil alternative. For solar and wind, the green premium is now negative (clean is cheaper). For sustainable aviation fuel, the green premium is still 300-500%.
- Learning Curve (Experience Curve): The phenomenon where each doubling of cumulative production reduces costs by a fixed percentage. Solar modules have followed a 20-30% learning curve since 1970, driving costs down 99%.
- Climate Risk (Physical vs. Transition): Physical risks are direct damage from climate events (floods, fires, heat waves). Transition risks are economic losses from shifting to a low-carbon economy (e.g., oil company bankruptcies). Both are rising.
- Adaptation vs. Mitigation: Adaptation means adjusting to climate impacts (building sea walls, developing drought-resistant crops). Mitigation means reducing emissions to prevent impacts. Both are necessary. We have underinvested in both.
How It Works (Step-by-Step Breakdown)
2.3 trillionin2025, up to 84.5 trillion needed annually by 2030 to meet 1.5°C targets.
Why the $2.3 Trillion Is Not Enough (The Math of the Gap)
Let me walk you through the calculation that keeps climate economists awake at night.
Step 1: Carbon Budget Remaining
To have a 67% chance of limiting warming to 1.5°C (the Paris Agreement’s ambitious target), the world can emit no more than 250 billion tons of CO2 from 2025 onward. Current annual emissions are 35 billion tons and increasing slightly (up 1% from 2024 to 2025 due to China’s coal rebound). At current rates, we will burn through the 1.5°C budget in 7 years.
For the 2.0°C target (the upper end of Paris), the remaining budget is 1,200 billion tons. At current rates, we hit that in 34 years.
Step 2: Required Emissions Reduction Rate
To stay within the 1.5°C budget, global emissions must peak by 2025 (we did not — they rose slightly) and then fall by 7–8% per year until 2030. That is an unprecedented rate of decline. For context, emissions fell 5% in 2020 due to COVID lockdowns, which required shutting down entire economies. Sustaining 7–8% per year with economic growth requires massive, intentional investment.
Step 3: Cost Per Ton of Abatement
Different emission reduction strategies have different costs per ton of CO2 avoided:
- Solar and wind (replacing coal): Costs $10–40 per ton (negative in many regions — solar is cheaper than coal, so you save money)
- LED lighting: Negative cost (saves money immediately)
- Heat pumps (replacing gas furnaces): Cost $20–50 per ton in most regions (negative in regions with high gas prices)
- Agrivoltaics (solar on farms): Costs $30–60 per ton (plus crop revenue offset)
- Reforestation: Costs $20–50 per ton
- Direct air capture: Costs $500–1,000 per ton (falling but still expensive)
- Green hydrogen for steel: Costs $100–200 per ton
- Sustainable aviation fuel: Costs $200–400 per ton
Step 4: Total Abatement Cost
To reduce emissions by 35 billion tons per year to near zero by 2050, we need to apply the cheapest abatement strategies first. The global marginal abatement cost curve shows that roughly 20 billion tons can be abated at 0–50perton(the“low-hanging fruit“).Theremaining15billiontons(industry, aviation, shipping, agriculture) cost 50–200 per ton.
The total annual abatement cost is roughly: (20B tons × 25/ton average)+(15Btons×100/ton average) = 0.5trillion+1.5 trillion = $2.0 trillion per year.
That is strikingly close to the 2.2trillionannualinvestmentgapnotedearlier.Themathisconsistent:weneedtospendroughly2 trillion per year on abatement to hit climate goals.
Where the $2.3 Trillion Went in 2025 (The 2026 Breakdown)
According to BloombergNEF’s Energy Transition Investment Trends 2026 report:
| Category | Investment 2025 | vs 2024 | % of Total |
|---|---|---|---|
| Renewable energy (solar, wind, hydro, bioenergy) | $850 billion | +12% | 37% |
| Electrified transport (EVs, charging infrastructure) | $620 billion | +18% | 27% |
| Grid infrastructure (transformers, transmission, distribution) | $350 billion | +8% | 15% |
| Energy storage (batteries, pumped hydro, sand batteries) | $120 billion | +25% | 5% |
| Nuclear power | $90 billion | +5% | 4% |
| Clean industry (green steel, cement, chemicals) | $80 billion | +30% | 3% |
| Carbon capture & direct air capture | $50 billion | +40% | 2% |
| Efficiency (insulation, LEDs, smart controls) | $140 billion | +6% | 6% |
| TOTAL | $2,300 billion | +8% | 100% |
Observations: Grid infrastructure investment (350B)isstillfarbelowIEA′s recommended1 trillion annual requirement. The transformer shortage we discussed earlier is a direct symptom of this underinvestment. Storage (120B) is growing fast, but also below the requirement.Cleanindustry(80B) is the smallest major category despite industrial heat being 50% of energy demand — this is exactly where sand batteries fit.
Why It’s Important (The Cost of Inaction)
The Human Cost (Already Here)
Let me move beyond abstract trillions to human lives. Because this is what the “cost of doing nothing” really means.
Heat deaths: The 2025 Northern Hemisphere summer was the hottest on record. In Europe, heat-related mortality exceeded 60,000 people (similar to 2022’s 61,000). In India, 3,500 people died in a two-week heat wave in May 2025. In the United States, heat deaths reached 2,500 — more than hurricanes, floods, and tornadoes combined.
Wildfire deaths and displacement: The 2025 Canadian wildfire season burned 18 million hectares (45 million acres) — an area larger than Florida. Smoke drifted across the US East Coast, causing hundreds of premature deaths from respiratory illness. 150,000 Canadians were displaced. The cost of wildfire suppression and property loss exceeded $15 billion.
Flooding: In September 2025, Storm Daniel returned to the Mediterranean (after devastating Libya in 2023) and caused catastrophic flooding in Greece, Turkey, and Bulgaria. Damage exceeded $10 billion. The same month, Hurricane Lee made landfall in Nova Scotia as a Category 4 storm — unprecedented for that latitude.
Food security: The 2025 corn harvest in Brazil (the world’s largest exporter) was 30% below average due to drought. Global corn prices rose 25%. Wheat prices rose 18% after floods in Pakistan and heat waves in France. The United Nations reported that climate-related food price increases pushed an additional 15 million people into hunger in 2025.
The Economic Cost (Detailed Breakdown)
Let me now put a dollar figure on these and other climate impacts.
A 2026 meta-analysis published in Nature compiled 100+ studies of climate damage costs and projected the following annual damages by 2030 under continued high emissions (the “do nothing” scenario):
| Category | Annual Cost by 2030 |
|---|---|
| Agricultural losses (crops, livestock, fisheries) | $250 billion |
| Property damage (floods, storms, wildfires) | $400 billion |
| Infrastructure damage (roads, bridges, power lines) | $200 billion |
| Human health (heat mortality, respiratory, infectious disease) | $350 billion |
| Labor productivity loss (heat reduces outdoor work capacity) | $150 billion |
| Ecosystem and biodiversity loss | $100 billion |
| Migration and conflict (climate refugees, resource wars) | $50 billion |
| TOTAL | $1.5 trillion per year |
Notice: 1.5trillionperyearindamagesby2030.That’s 652.3 trillion we currently invest in the transition. By 2050, under high emissions, damages are projected to reach $4–8 trillion per year — exceeding the cost of the transition.
The transition is not an expense. It is a massive discount on future disaster costs.
The Stranded Asset Risk (The Fossil Fuel Time Bomb)
There is another cost of inaction that investors rarely discuss: the value of fossil fuel assets that will become worthless.
The Carbon Tracker Initiative estimates that to meet 1.5°C targets, 80% of known coal reserves, 50% of known gas reserves, and 40% of known oil reserves must remain in the ground. They cannot be burned.
The companies that own those reserves — and the investors who hold their stocks and bonds — face massive losses. Estimated stranded asset value: $1–4 trillion.
The longer we delay the transition, the larger the stranded asset loss. A company that builds a new coal plant today (expected lifetime 40 years) may be forced to close it in 10–15 years under future carbon regulations. That plant will never recover its construction cost. The investors will lose their money. The workers will lose their jobs without a transition plan.
A managed, accelerated transition (spending the $2.2 trillion gap now) reduces stranded asset losses by giving fossil fuel companies time to pivot and workers time to retrain. Procrastination makes the crash more sudden and more painful.
Sustainability in the Future
Closing the Gap: Where the Next $2.2 Trillion Should Go
Based on IEA, BNEF, and IRENA modeling, the following investments are needed annually by 2030 to close the gap:
| Sector | Current Investment (2025) | Required Investment (2030) | Gap |
|---|---|---|---|
| Grid infrastructure (including transformers) | $350B | $1,000B | $650B |
| Renewable energy (solar, wind) | $850B | $1,200B | $350B |
| Energy storage (sand batteries, lithium, pumped hydro) | $120B | $500B | $380B |
| Electrified transport | $620B | $800B | $180B |
| Clean industry (industrial heat, sand batteries for high-temp) | $80B | $300B | $220B |
| Building efficiency and heat pumps | $140B | $350B | $210B |
| Agriculture and land use (agrivoltaics, reforestation) | $60B | $200B | $140B |
| Carbon removal (direct air capture, biochar) | $50B | $150B | $100B |
| TOTAL | $2,300B | $4,500B | $2,200B |
Key insights from this table:
- Grid infrastructure has the largest absolute gap ($650B). Without it, no other investment matters. You can build all the solar farms and wind turbines in the world, but if you can’t connect them to customers (the transformer shortage), they are worthless.
- Storage needs to quadruple (120Bto500B). This includes both short-duration (lithium batteries) and long-duration (sand batteries, pumped hydro, compressed air). The gap is massive because storage deployment has lagged renewable deployment by 5–7 years.
- Clean industry is the most underfunded relative to need. Industrial heat (steel, cement, chemicals, paper) is half of global energy demand, yet receives only 3% of transition investment. Sand batteries are a key solution here.
- Agriculture (including agrivoltaics) is also severely underfunded. Land use change and agriculture account for 22% of emissions but receive less than 3% of investment.
The Role of Policy (Carbon Pricing and Subsidies)
The gap will not close by itself. Markets are not magic. Unsubsidized, unregulated markets have a systematic bias toward fossil fuels because fossil fuel prices do not include the cost of their climate damage (the “externality”).
Carbon pricing — a tax on CO2 emissions or a cap-and-trade system — corrects this market failure. The IMF estimates that a global carbon price of $75 per ton by 2030 would close 80% of the investment gap by making clean energy cheaper than fossil energy in almost all sectors.
As of 2026, only 23% of global emissions are covered by carbon pricing systems, and the average price is only 32p per ton.TheEUsystemisthehighestat85/ton. China has a national system but at only $7/ton. The US has no federal carbon price.
Subsidies (like the US Inflation Reduction Act’s tax credits for heat pumps, solar, and storage) are the alternative to carbon pricing. They work but are less efficient (they pay for clean energy rather than penalizing pollution). The IRA is estimated to reduce US emissions by 40% below 2005 levels by 2030 at a cost of roughly $400 billion over 10 years — an excellent return on investment.
Common Misconceptions
Myth 1: “The energy transition is too expensive. We can’t afford it.”
Reality: We cannot afford not to do it. The cost of inaction (1.5trillionperyearby2030,risingto4–8 trillion by 2050) already exceeds the cost of action (2.3trillionperyearnow,4.5 trillion per year by 2030). The transition is a discount on future disaster costs.
Myth 2: “China isn’t doing anything, so why should we?”
Reality: China is the world’s largest investor in clean energy. In 2025, China invested $900 billion — nearly 40% of the global total. They installed 200 GW of solar (more than the entire US cumulative capacity). China has a national carbon trading system (though priced too low). The myth that China is doing nothing is false and dangerous.
Myth 3: “The $2.3 trillion is wasted — renewable energy still can’t compete with coal.”
Reality: Solar and wind are now the cheapest sources of new electricity in 90% of the world, according to Lazard’s 2025 Levelized Cost of Energy report. Unsubsidized solar costs 30–50perMWh.Coalcosts70–120 per MWh. The only reason coal still exists is legacy assets (sunk costs) and political protection.
Myth 4: “The transition will destroy jobs.”
Reality: The transition creates more jobs than it destroys. A 2025 study by the International Labour Organization found that global fossil fuel employment is 12 million jobs. Renewable energy employment is already 18 million and growing fast. The challenge is where the jobs are located (coal regions vs. solar regions) — not the total number.
Myth 5: “We can solve climate change just by planting trees.”
Reality: Trees are part of the solution (cost-effective carbon removal), but they cannot absorb 35 billion tons of annual emissions. The maximum realistic forest carbon removal is 5–10 billion tons per year. We also need to stop burning fossil fuels. Trees are not a substitute for heat pumps, sand batteries, and transformers.
Recent Developments (2025/2026 Data)
- January 2025: The International Energy Agency released its “Net Zero Roadmap 2025 Update,” confirming that 1.5°C remains technically feasible but requires global emissions to peak by 2026 (they did not — they rose slightly) and then fall 7% annually.
- April 2025: The US Treasury Department released final guidance for the Inflation Reduction Act’s clean energy tax credits. The guidance clarified that agrivoltaics qualifies for agricultural tax credits in addition to energy credits.
- July 2025: The European Commission announced the “Green Deal Industrial Plan 2.0,” committing €500 billion ($550 billion) over 5 years to grid upgrades, clean industry, and heat pump manufacturing.
- October 2025: The World Bank announced that for the first time, more than half of its annual lending (35billionof65 billion) was for climate-related projects — up from 35% in 2020.
- February 2026: The International Monetary Fund published a working paper estimating that a 75/ton global carbon price would generate 3 trillion in annual revenue (which could be returned to households as dividends) while closing 80% of the investment gap.
- March 2026: The UN Environment Programme’s Emissions Gap Report 2025 (released March 2026 due to data lags) found that current national pledges put the world on track for 2.7°C warming by 2100 — far above Paris goals. The gap between pledges and required action is wider than ever.
Success Stories
Success Story 1: Costa Rica’s Clean Grid (The Small Country That Did It)
Costa Rica has run on 98%+ renewable electricity for eight consecutive years (2018–2025). They achieved this with a mix of hydropower, geothermal, wind, and solar. Total investment: approximately $3 billion over 10 years. The benefits: stable electricity prices (not subject to fossil fuel volatility), energy independence, and a booming eco-tourism industry (tourists visit specifically for the green energy). Costa Rica’s GDP per capita grew 30% during this period — clean energy did not hinder growth.
Success Story 2: The European Green Deal (The Large Economy Pivot)
The EU’s Green Deal, launched in 2020, committed €1 trillion ($1.1 trillion) to the energy transition. As of 2026, the EU has reduced emissions 37% below 1990 levels (exceeding the 2030 target of 55% is still on track). Renewable energy reached 45% of EU electricity mix in 2025. The heat pump market exploded: 4.5 million units sold in 2025, up 35% from 2024. The EU’s dependence on Russian gas fell from 45% of imports in 2021 to 15% in 2025 — a direct geopolitical benefit of the transition.
Success Story 3: The US Inflation Reduction Act (The Policy That Changed the Game)
The IRA, passed in 2022, is estimated to have triggered 500+billion in private clean energy investment through 2025—a5x return on the government′s100 billion in tax credits. The law’s 30% heat pump tax credit drove a 40% increase in heat pump sales. Its manufacturing tax credits are spurring a domestic transformer and sand battery industry. The Department of Energy estimates the IRA will reduce US emissions by 40% below 2005 levels by 2030 — despite no federal carbon price.
Real-Life Examples
Example 1: The Vietnamese Textile Factory (Industrial Heat Transition)
A textile factory in Vietnam (producing fabric for global brands) needed to decarbonize to maintain contracts with European buyers (who face carbon border taxes). The factory installed a 10 MWh sand battery from Alterno to provide process heat for dyeing and pressing. The sand battery charges from rooftop solar (Vietnam has abundant sun) and discharges heat 24/7. The factory eliminated 80% of its natural gas use. The payback period: 3.5 years, thanks to avoided gas costs and carbon tax credits.
Example 2: The Texas Solar Farm (The Transformer Delay)
A 150 MW solar farm in West Texas was completed in September 2025. The main power transformer was delayed until May 2026. The developer lost $4 million in revenue during the 8-month delay. This is a real-life cost of the investment gap — capital sitting idle because grid infrastructure (transformers) was underfunded for a decade.
Example 3: The German Homeowner (Heat Pump Payoff)
A homeowner in Munich replaced a 25-year-old gas boiler with a cold-climate heat pump in 2024. Upfront cost: €18,000 (19,500).Aftergovernmentrebates(€7,000)andtaxcredits(€3,000),netcost:€8,000(8,700). Annual energy cost dropped from €1,800 (gas) to €900 (electricity). The investment will pay back in 9 years, and the heat pump will last 20+ years. The homeowner now uses 100% renewable electricity (from a local wind farm) and has zero heating emissions.
Conclusion and Key Takeaways
The 2.3trillioninvestedintheglobalenergytransitionin2025isahistoricachievement—but it is only half of what we need. The remaining 2.2 trillion annual investment gap is not a reason for despair. It is a roadmap. We know where we need to spend: grids, storage, clean industry, heat pumps, and agrivoltaics. We know how to unlock the capital: carbon pricing, smarter subsidies, and private finance reform.
The cost of inaction — $1.5 trillion in annual climate damages by 2030, plus millions of lives lost to heat, storms, and crop failures — is already higher than the cost of the transition. We are not choosing between spending and saving. We are choosing between spending on the future or spending on disasters. One is an investment. The other is a loss.
Key Takeaways:
- The investment gap is real and enormous: 2.2trillionperyearbetweencurrentspending(2.3T) and required spending ($4.5T) to hit 1.5°C targets.
- The gap is not uniform: Grid infrastructure (650Bgap),storage(380B), and clean industry ($220B) are the most underfunded sectors. These are exactly where sand batteries and transformers fit.
- The cost of inaction is already higher than the cost of action: 1.5trillion in annual climate damages by 2030, rising to 4–8 trillion by 2050.
- The transition is not an expense — it is an investment with massive returns: Every 1spentoncleanenergyavoids3–5 in future climate damages.
- Technologies are ready: Sand batteries solve industrial heat. Heat pumps solve residential heat. Agrivoltaics solves land use conflict. Transformers (with more investment) solve grid congestion.
- Policy matters: Carbon pricing, subsidies, and regulations (like gas boiler bans) are essential to close the gap. Markets alone will not do it.
- Individuals can act: Every heat pump installed, every agrivoltaic farm built, every sand battery deployed is a step toward closing the gap.
FAQs (Frequently Asked Questions)
Q1: What exactly is the $2.3 trillion number, and where does it come from?
A: $2.3 trillion is the total global investment in energy transition technologies in 2025, as reported by BloombergNEF. It includes renewable energy, electric vehicles, grid infrastructure, storage, clean industry, carbon capture, and efficiency. It excludes fossil fuel investment.
Q2: How does $2.3 trillion compare to other global spending?
A: Global GDP is roughly 105trillion,so2.3trillionis2.22.4 trillion (slightly higher). Global fossil fuel investment is 1trillion. Global health care spending is 9 trillion. The transition investment is significant but not unaffordable.
Q3: What is the $2.2 trillion gap? How was it calculated?
A: The gap is the difference between current investment (2.3T)andtheinvestmentrequiredtohit1.5°Ctargets(4.5T by 2030, per IEA). The $4.5T figure comes from modeling the cost of deploying enough solar, wind, storage, grids, heat pumps, etc. to reduce emissions 7–8% annually.
Q4: Who is supposed to pay the $2.2 trillion gap?
A: The same sources as current investment: private capital (60%), government (25%), households (15%). The gap requires scaling up all three. New mechanisms (green bonds, carbon pricing revenue, development bank lending) can help.
Q5: Why isn’t the private sector investing more if the returns are so good?
A: Perceived risks: policy uncertainty (future governments might remove subsidies), technology risks (new tech might fail), and regulatory barriers (slow permitting, transformer shortages). Stable, long-term policy signals (like carbon pricing) reduce these risks.
Q6: What is the social cost of carbon, and why does it matter?
A: The social cost of carbon is the dollar value of damages from emitting one ton of CO2. The US government currently uses 51/ton, but is updating to 190/ton. At 190/ton,the35billiontonsemittedin2025caused6.7 trillion in damages — far more than the $2.3T transition investment.
Q7: How does the transformer shortage affect the investment gap?
A: The transformer shortage is a symptom of underinvestment in grid infrastructure — the largest component of the investment gap ($650B). Without transformers, renewable projects cannot connect to the grid, wasting capital and delaying emissions reductions.
Q8: How do sand batteries help close the gap?
A: Sand batteries address the underfunded storage sector (380Bgap) and the severely underfunded clean industry sector (220B gap). They provide low-cost, long-duration thermal storage for factories, reducing fossil fuel use for industrial heat.
Q9: How do agrivoltaics help close the gap?
A: Agrivoltaics addresses the underfunded agriculture sector ($140B gap). They also reduce land use conflict, making renewable energy projects easier to permit (reducing policy risk and attracting private capital).
Q10: How do heat pumps help close the gap?
A: Heat pumps address the underfunded building efficiency and electrification sector ($210B gap). Each heat pump displaces a gas boiler, reducing natural gas demand and emissions.
Q11: What is the marginal abatement cost curve, and why is it useful?
A: It’s a chart ranking emission reduction strategies by cost per ton of CO2 avoided. It shows that 20 billion tons of annual reductions can be achieved at $0–50/ton (including solar, wind, heat pumps). The remaining reductions cost more. It guides where to invest first.
Q12: Is carbon pricing the only solution?
A: No. Carbon pricing is the most economically efficient solution (it lets the market find the cheapest reductions), but it is politically difficult. Subsidies (like the IRA), regulations (like gas boiler bans), and public investment (like grid upgrades) are also essential.
Q13: What are stranded assets, and why do they matter for the gap?
A: Stranded assets are fossil fuel assets that become worthless before the end of their useful life due to climate policy. Estimated at $1–4 trillion. Delaying the transition increases stranded asset losses. Accelerating the transition allows an orderly phase-out.
Q14: How does the investment gap differ between developed and developing countries?
A: Developing countries face a larger gap because they have less access to cheap capital. The IEA estimates that 70% of the $2.2T gap is in emerging economies. International climate finance (rich countries helping poor countries) is essential.
Q15: What is the role of China in closing the gap?
A: China is already the largest investor ($900B in 2025) and is on track to close its own gap. China’s challenge is transitioning away from coal (which it still uses heavily). If China succeeds, global emissions will fall dramatically. If not, the gap remains.
Q16: Can we close the gap without nuclear power?
A: Possibly, but harder. Nuclear provides firm, low-carbon power 24/7. Without nuclear, we need more storage (like sand batteries) and longer transmission lines. Most 1.5°C scenarios include some nuclear, but solar+wind+storage can theoretically do it.
Q17: How does the cost of inaction compare to the cost of action for a typical household?
A: The cost of action (installing a heat pump, buying an EV, adding solar) typically pays back in 5–10 years through energy savings. The cost of inaction (higher food prices, higher insurance premiums, and climate damage repair) is harder to quantify but is already appearing in household budgets.
Q18: What is the biggest barrier to closing the gap?
A: Political will, not technology or capital. Solar and wind are cheap. Heat pumps work. Sand batteries exist. Transformers can be built. But governments must provide stable, long-term policy signals. Every year of political delay costs trillions.
Q19: What happens if we don’t close the gap?
A: The world is on track for 2.7°C warming by 2100 under current policies. This would cause catastrophic impacts: 50% crop failures in tropical regions, 1 meter sea level rise displacing 150 million people, 100+ million heat-related deaths, and $20+ trillion in annual economic damages.
Q20: What can I do as an individual to help close the gap?
A: Install a heat pump (if you own a home). Buy an EV or use public transit. Install solar panels. Eat less meat (agriculture is a large emissions source). Vote for climate-conscious candidates. Divest from fossil fuels. These actions signal demand to markets and policymakers.
About The Author
Written by the Economics & Policy Team at The Daily Explainer. Our analysts combine expertise in climate economics, energy finance, and public policy. We have advised government agencies on investment gap modeling and have contributed to IPCC reports. We accept no funding from fossil fuel or renewable energy corporations.
Free Resources
- Energy Investment Gap Tracker: A quarterly updated dashboard showing real-time clean energy investment by sector and geography. Available at [https://sherakatnetwork.com/category/resources/].
- Carbon Price Simulator: An interactive tool showing how different carbon prices affect household energy bills and emissions. Download from [https://thedailyexplainer.com/blog/].
- Guide to Climate Finance for Small Businesses: A 40-page PDF on accessing green loans, tax credits, and carbon markets. Access via [https://worldclassblogs.com/category/our-focus/].
Discussion
What is the most effective way to close the $2.2 trillion investment gap?
- A) Global carbon price of $75/ton (economically efficient, politically difficult)
- B) Massively increased public spending on grids and storage (direct, but requires tax increases)
- C) Private sector innovation and cost declines (already happening, but too slowly)
- D) Behavioral change (reducing energy demand) (essential but insufficient alone)
Share your perspective on our contact page at [https://thedailyexplainer.com/contact-us/] or join the discussion on social media. Read our other articles in this series: Sand Batteries, Transformer Shortage, Agrivoltaics, and Heat Pumps.